 PS Login
 Webmail


Projects / Programs
Functioning of PZP
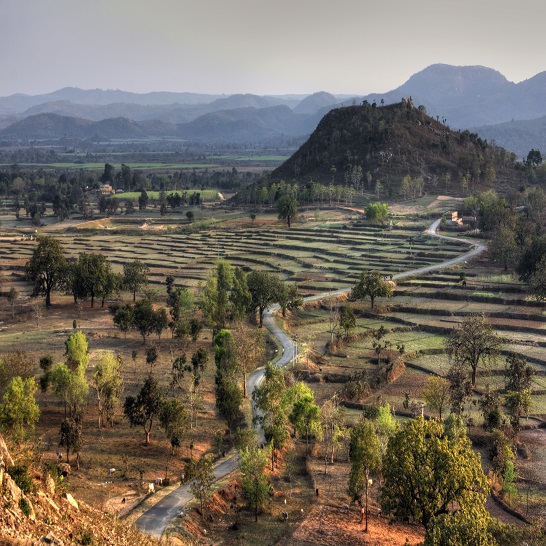
ABOUT PURULIA
Demographic Features :-
As per 2001 census total population of the district is 2535516, out of which 89.93 % are residing in rural areas and 10.07% are in urban areas. About 51.18 % of the populations are males and 48.82% are female. The percentage of Scheduled Caste and Scheduled Tribes are 18.29% and 18.27%.
Total no of BPL families in rural areas of this district are 197381 (43.65 %). Out of which SC families are 40645 (20.59 %) and ST families are 47666 (24.15 %). Total no. of BPL families in Purulia and Jhalda Municipality are 2573 (11.31 %) and 571(15.98 %) respectively.
| 1991 Census | % | 2001 Census | % | |
| Total Population | 2224577 | 2536516 | ||
| Male Population | 1142771 | 51.37 | 1298078 | 51.18 |
| Female Pop. | 1081806 | 48.63 | 1238438 | 48.82 |
| Rural Population | 2014571 | 90.56 | 2281090 | 89.93 |
| Urban Population | 210006 | 9.44 | 255426 | 10.07 |
| Scheduled Caste | 430513 | 19.35 | 463956 | 18.29 |
| Scheduled Tribe | 427765 | 19.23 | 463452 | 18.27 |
| Sex Ratio | 947 | 954 | ||
| Population Density (per sq. km.) | 355 | 405 | ||
| Decadal Growth Rate | 20.00 (1981-91) |
14.02 (19991-2001) |
Occupation Distribution :-
Main working class has been decreased from 35.35 % in 1991 to 25.43 % in 2001 census whereas Marginal working class has been increased from 7.8 % in 1991 to 19.03 % in 2001 census. Cultivators have been shifted to other working classes.
| 1991 Census | % | 2001 Census | % | |
| 1. Main Worker | 786425 | 35.35 | 644748 | 25.43 |
| A. Cultivators | 389186 | 40.54 | 352104 | 31.24 |
| B. Agri. Labours | 200205 | 20.85 | 406835 | 36.09 |
| C. H.H. Industry | 21768 | 2.77 | 83633 | 7.42 |
| D. Other Workers | 175266 | 22.28 | 284584 | 25.25 |
| 2. Marginal Workers | 173539 | 7.8 | 482408 | 19.03 |
| 3. Non Workers | 1264613 | 56.85 | 1408077 | 55.54 |
Note:
In 1991 census cultivators, agri. labours etc were included in main worker group and marginal workers were enumerated separately. But in 2001 census cultivators, agri. labours etc were enumerated either in main worker or in marginal worker group. So no. of marginal workers, agri. labours, hh industry worker etc were comparatively higher than 1991.
Agriculture :-
Cultivation of this district is predominantly monocropped. About 60 % of the total cultivated land is upland. Out of the total agricultural holding about 73 % belongs to small and marginal farmers having scattered and fragmented smallholding. Paddy is the primary crop of the district. 50% of the total land is under net-cropped area and only 17% of the net cropped area is under multi crop cultivation. 77% of the net-cropped area is under Aman paddy cultivation. The crops are grown mostly under rainfed condition, generally with low fertilizer consumption per unit area Thus per hec. production is also low as compared to other district of West Bengal.
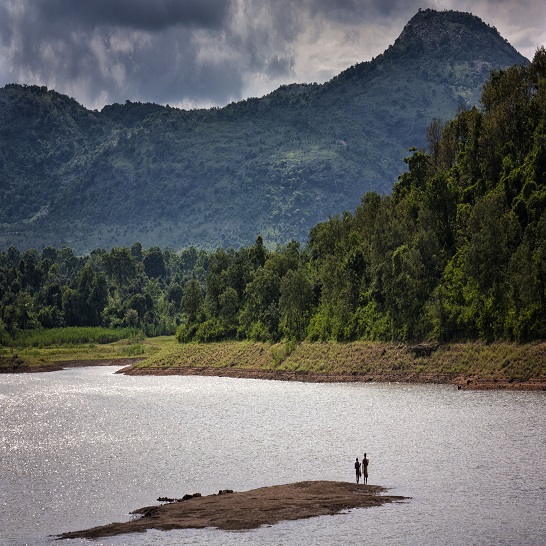
Fisheries :-
The production of fish in this district is not much encouraging though a large no. of tanks both under Govt. & Private sector are there. If these tanks are utilised properly for Pisciculture and Duck rearing the production of fish as well as eggs will be increased to a considerable extent thereby increasing the scope of income & employment to the rural people. Total inland area of the district is 71,255 hec.. So, there is an ample possibility to bring more area under efficient pisciculture.
The details of cultural area covering Govt. and private Tanks are given below
Private Culturable water area – 37753.26 Ha.
Vested tank water area – 9223.24 Ha.
Dam and Reservoir – 3039.10 Ha.
Departmental Tank – 62.40 Ha.
Total 1419.10 Ha. water area covered during last three years for pisciculture through distribution of minikit, production of fry/fingerlings, demonstration centre on table fish production, supply of fishing nets and requisits, infrastructural facilities as fishermen village road, community hall, housing etc. and development of different fishermen co-operative sector through pisciculture, training etc. Total 6,807 fishermen were benefited.
Irrigation :-
There is altogether 32 Nos. of medium irrigation Schemes (17 under Purulia Irrigation Divn., 6 under Construction Divn and 9 under Investigation & Planning Divn. ) in this district. Out of these 32 Schemes, 23 are completed and 9 are in various stages of execution. Four new schemes Karru,Dambera,Dudhiajore and Horai are programmed for execution during the 10th Plan.
There are altogether 135 RLI schemes with effective command area 138 hec. Out of which 21 nos. are electrified and rest 114 nos. are diesel operated. Out of these schemes 16 are permanently defunct. 17 nos. Mini RLI in the different remote areas have been installed so far.
There are altogether 61 Minor Irrigation Schemes. The total Irrigation Potential created are 8541 hec in Kharif and 1955 hec in Rabi. No. of Dug-well constructed so far are 4218 nos.
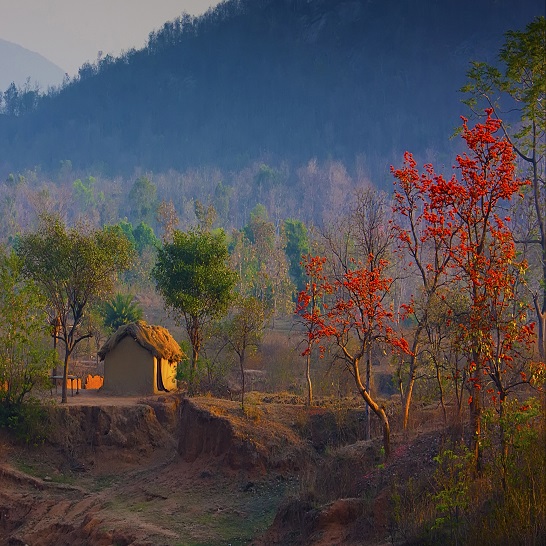
Forestry :-
Total forest coverage in this district including social forestry and degraded forest as per Satellite Imagery data is 185726 ha which is 29.69 % of the total land of the district. As per report of the forest dept. total area under forest Dept. is 115226 ha.
The management and maintenance of Forest is being done by Joint Forest Protection Committees under active control of different divisions of Forest Department. At present 702 nos. of Forest Protection Committees (Purulia Divn.-171, KSC-I Divn.-235) are working in this district. These committees have not only helped to protect the plantation areas but have also guarded against illegal felling of trees.
The natural forests of the district are mostly of mixed nature and restricted to northwest part of the district covering Ajodhya Hills and Panchet hills of northeast. As per Remote sensing data the forest cover of this district is increasing compare to its past status. The extensive farm and social forestry plantation programs might have contributed in a big way to the increase in the forest cover. Forest types Purulia district as per Satellite Imagery data (IRS-IB LISS II Dec. 1994) are shown below:
| Sl. No. | Name of the class | Area ( Sq. km.) | Percentage to the total area of the district |
| 1. | Dense Sal Forest | 37.98 | 0.61 |
| 2. | Mixed Dense Forest | 141.97 | 2.27 |
| 3. | Open Sal Forest | 112.27 | 1.80 |
| 4. | Mixed Open Forest | 762.83 | 12.20 |
| 5. | Plantation | 124.45 | 1.98 |
| 6. | Degraded Forest | 677.76 | 10.83 |
| TOTAL | 1857.26 | 29.69 |